Inviting a new generation of visitors to Museum Rietberg through a thrilling adventure in the beautiful Rieterpark
Team
Armin Aschenbrenner
Elena Walter
Luis Praxmarer
Client
Museum Rietberg
Category
UI/UX Design
Service Design
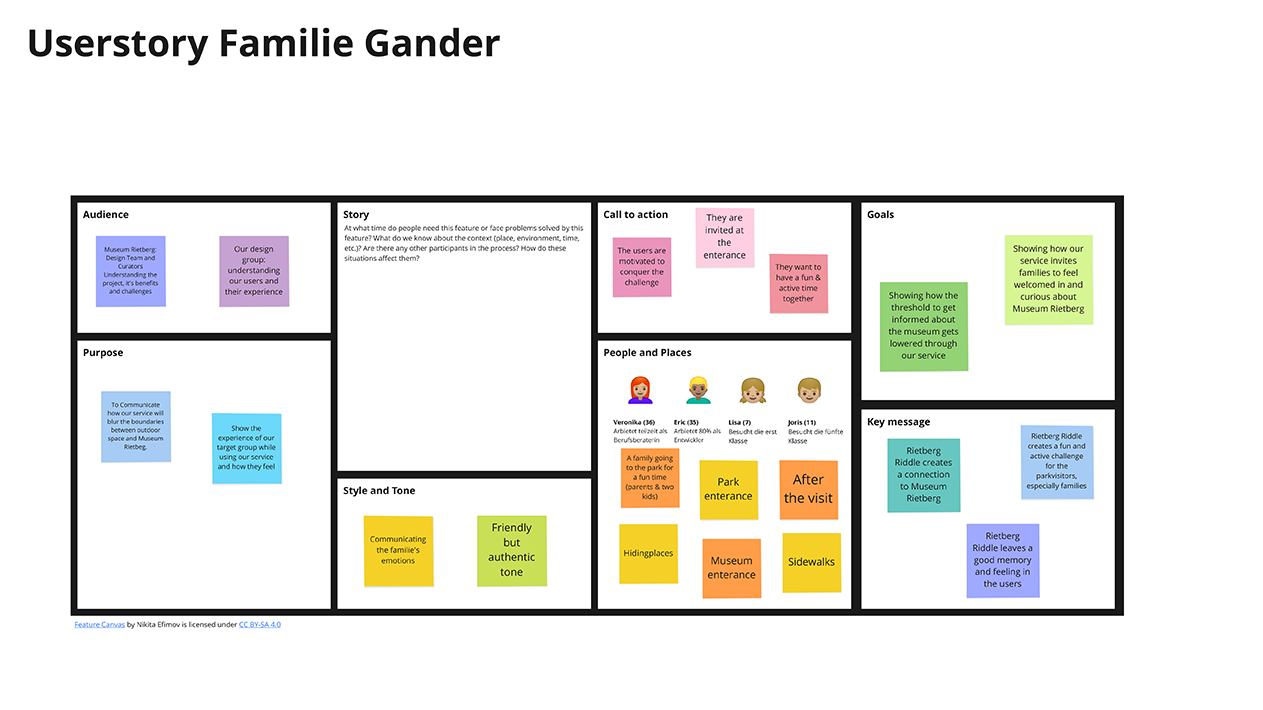
User Group
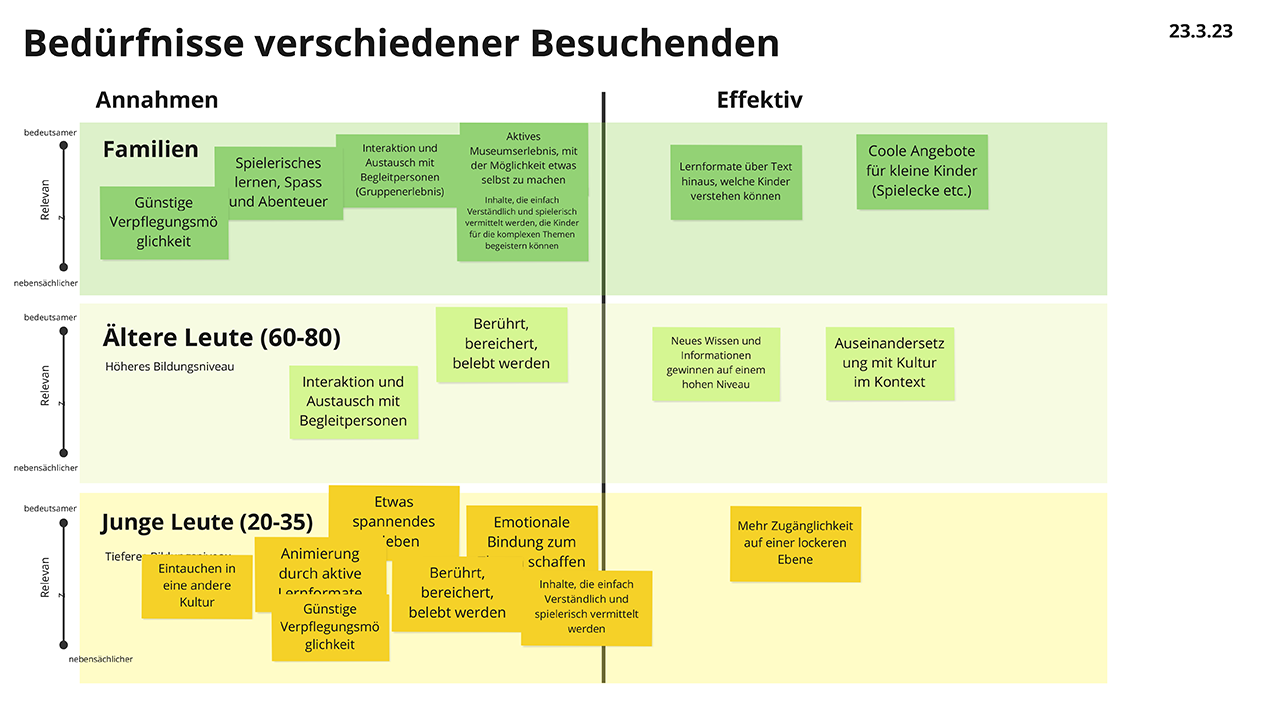
Families
Museum Rietbergs Pain Point
How can we increase the number of visitors to the museum?
Since the pandemic in 2020 Museum Rietberg faces declining visitor numbers. This is related to the fact that their largest visitor demographic is aged 60 and above. My team and I were tasked to develop a strategy to increase the numbers again and attract a new generation of visitors.
Challenge
How can we excite younger generations for the versatile offers of Museum Rietberg?
Through thorough field and desk research and the analysis of the situation we realized that that Museum Rietberg lacks awareness and active communication among younger audiences.
Solution
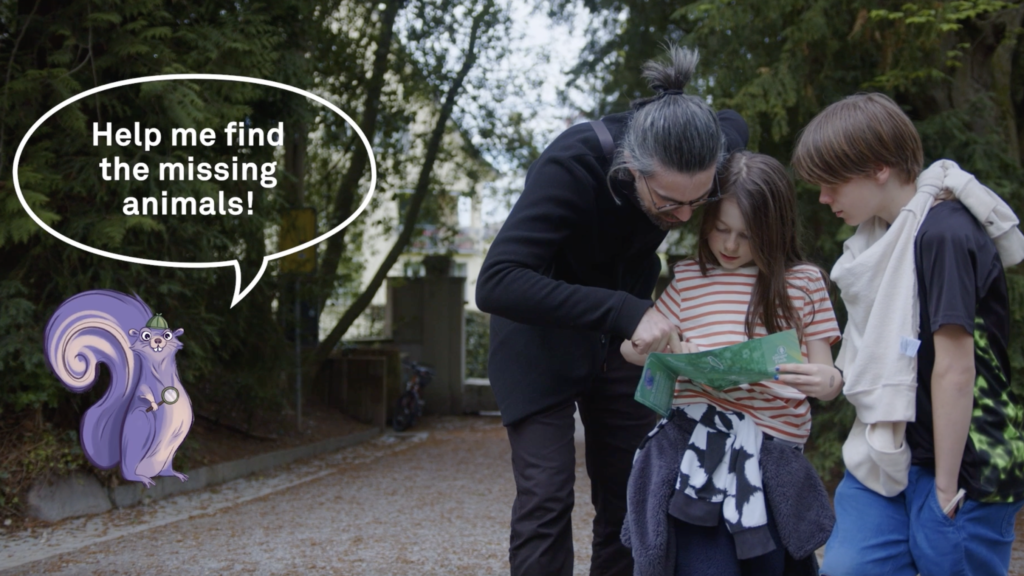
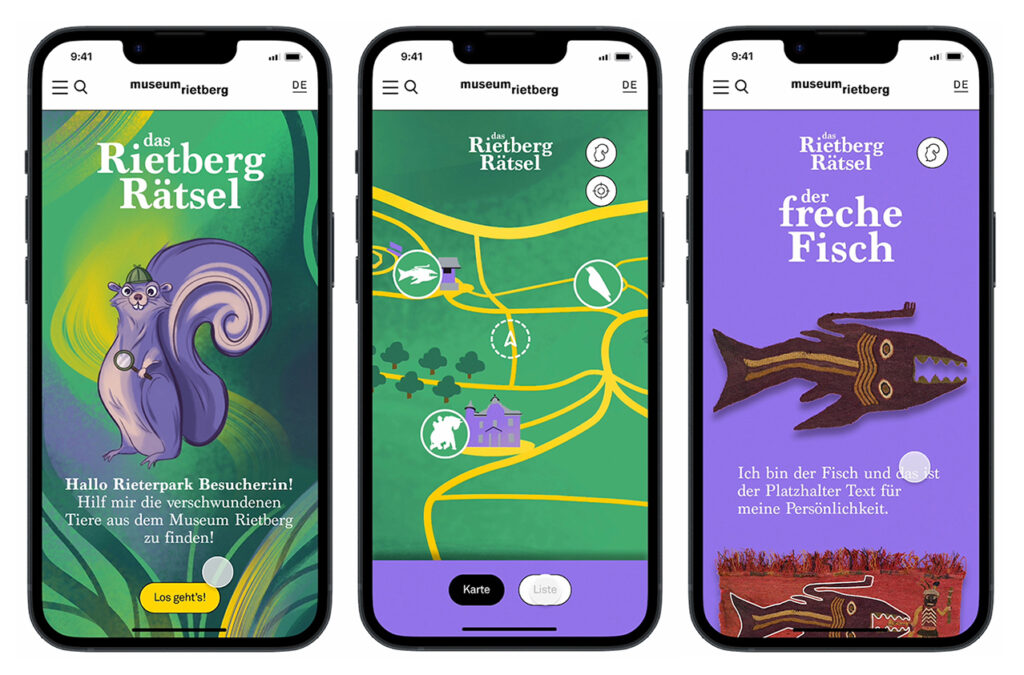
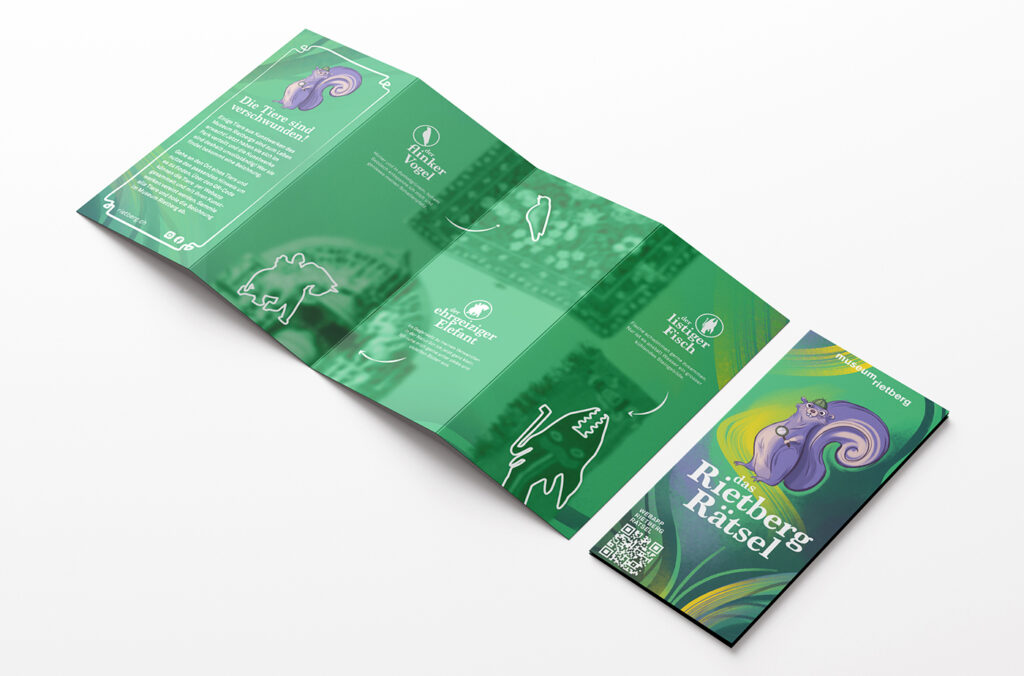
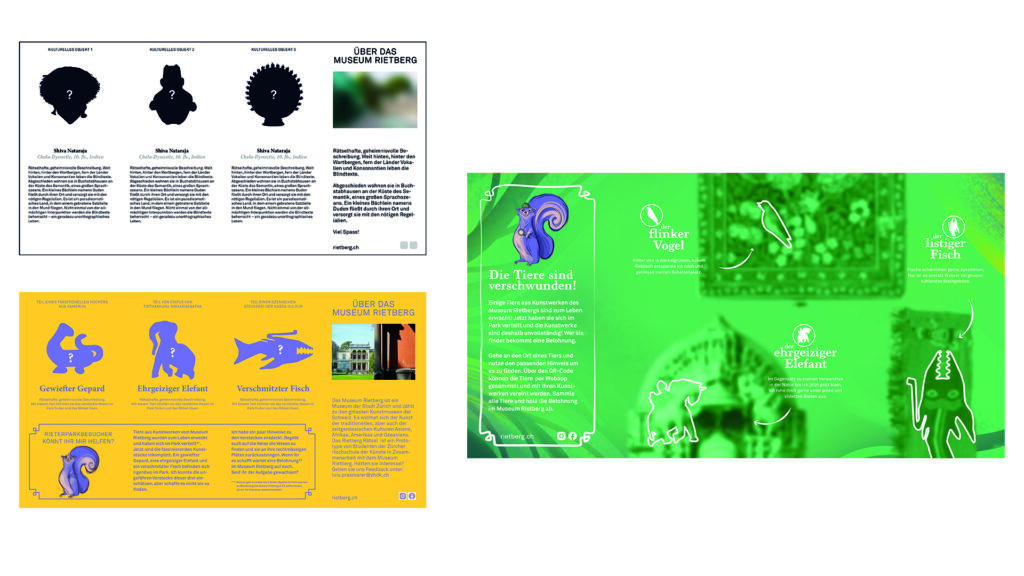
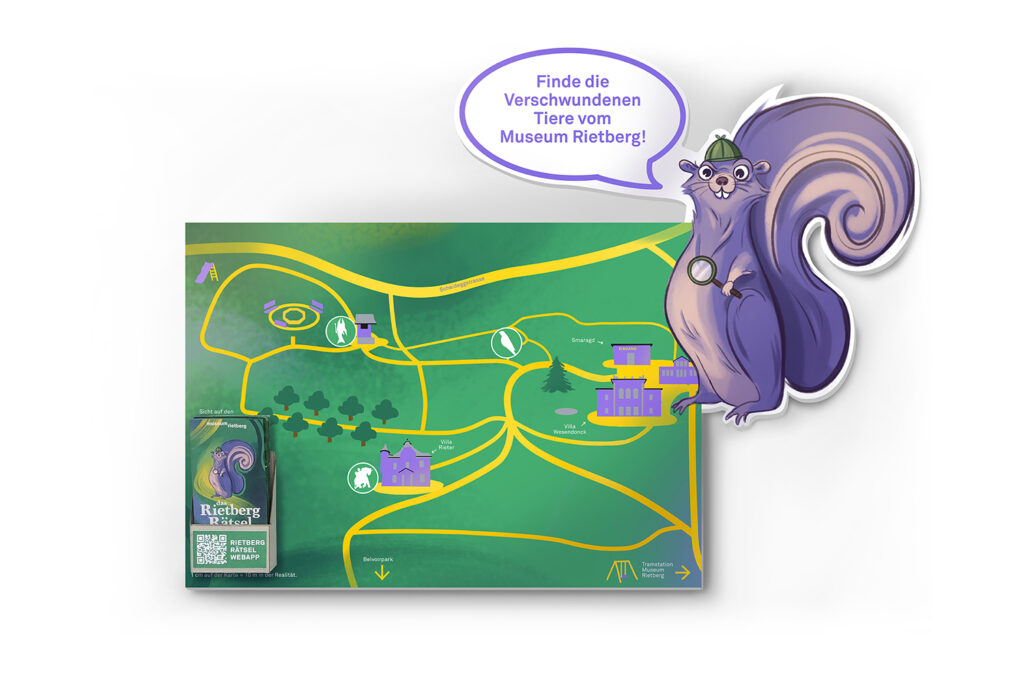
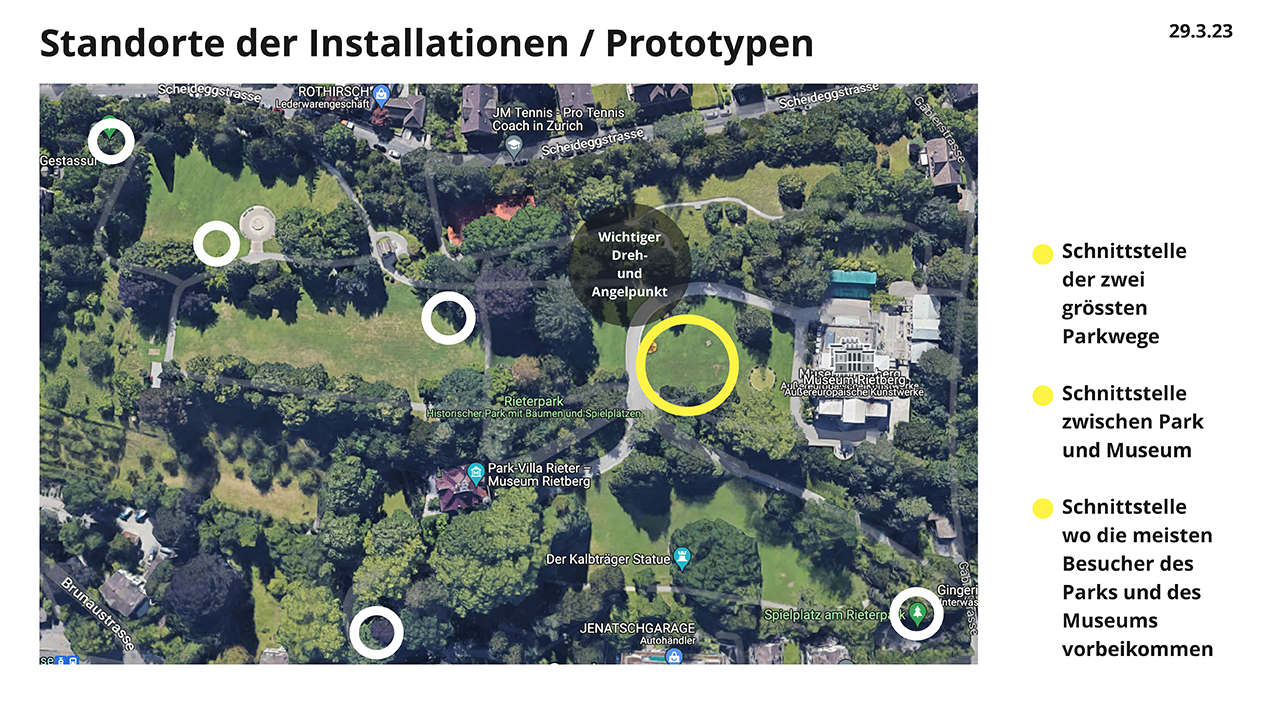
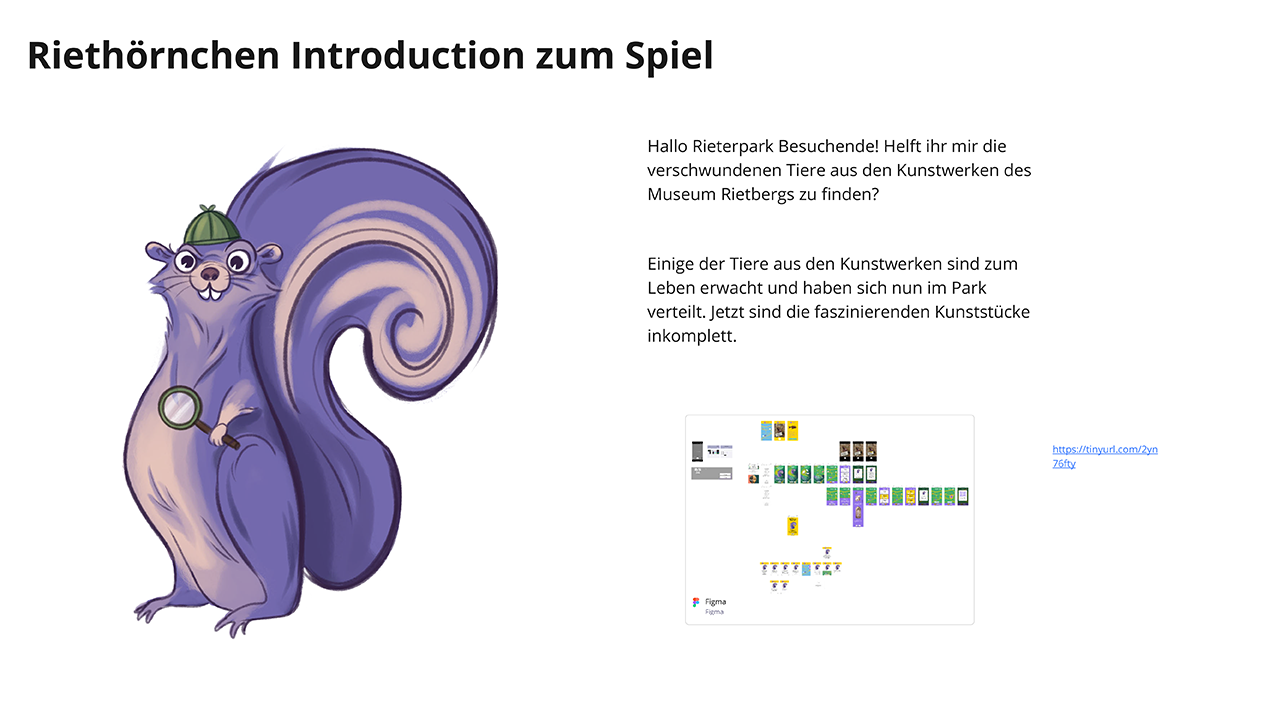
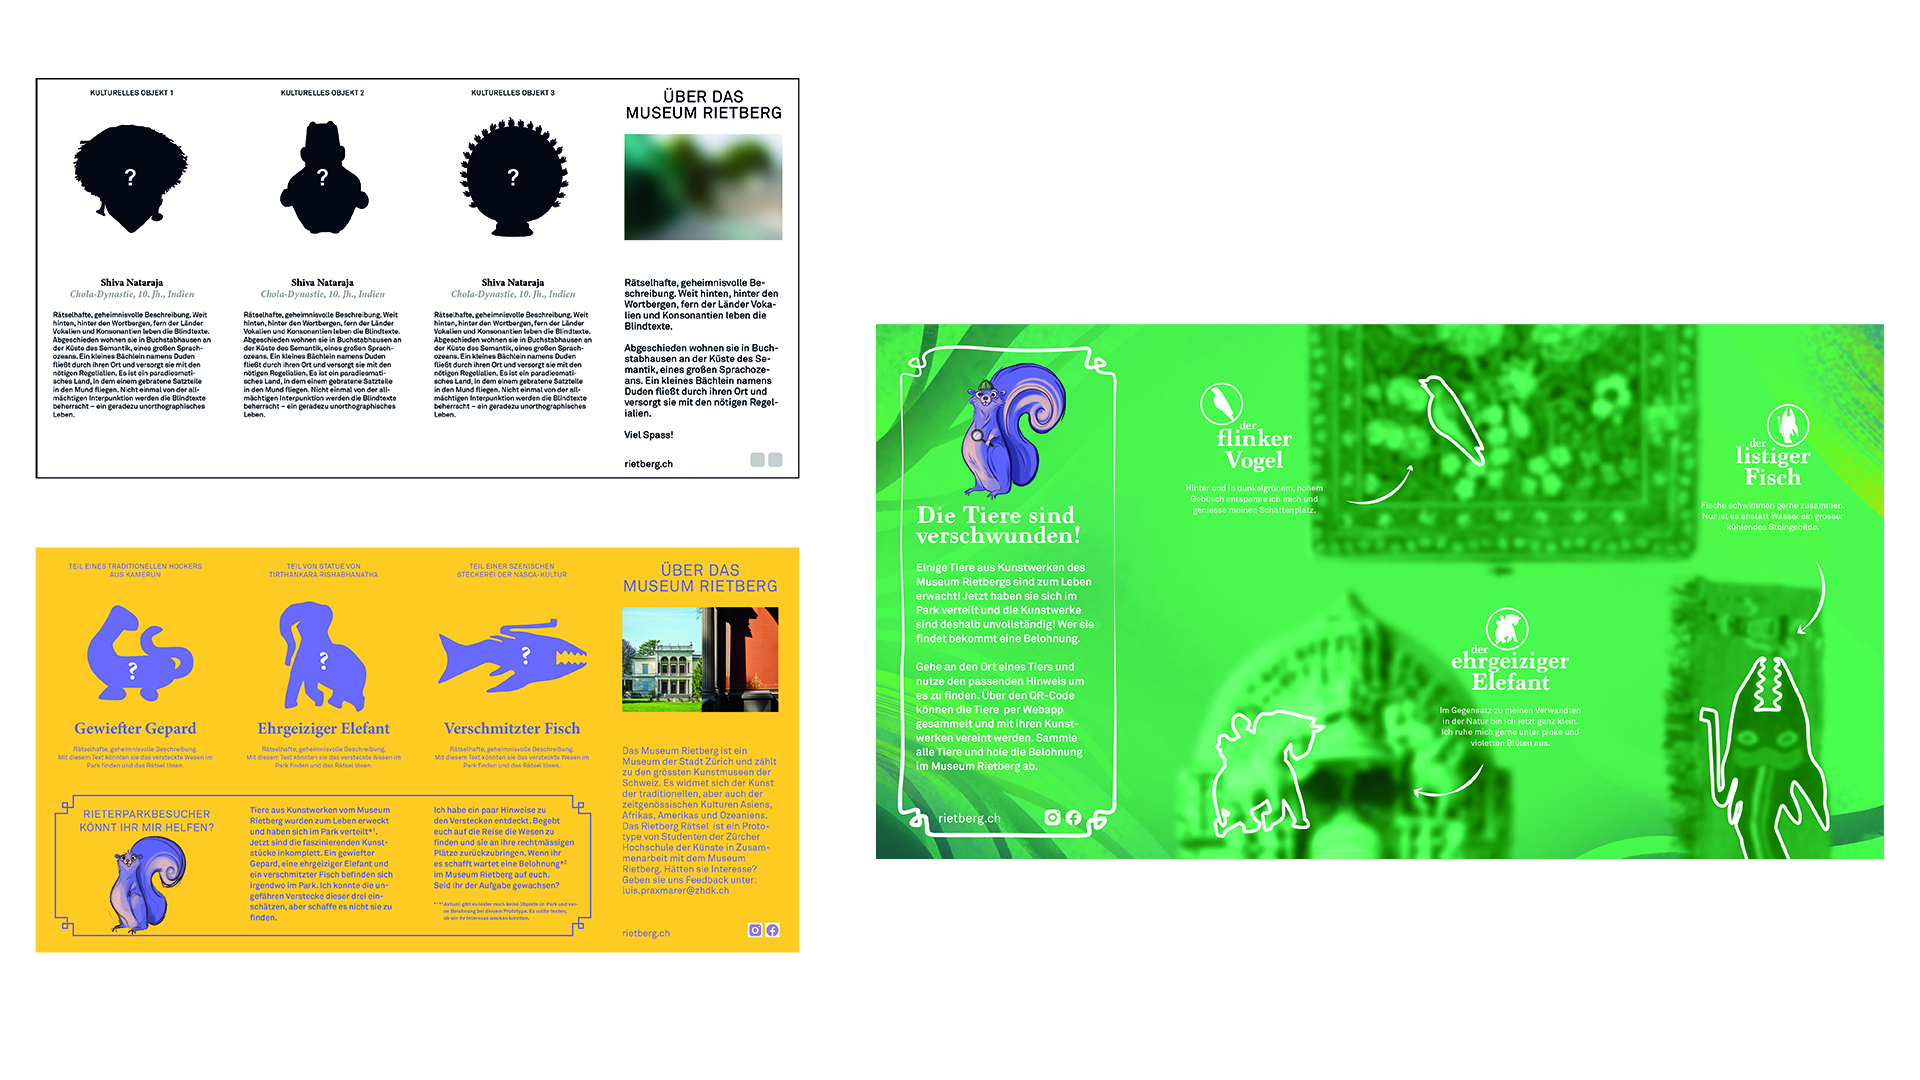
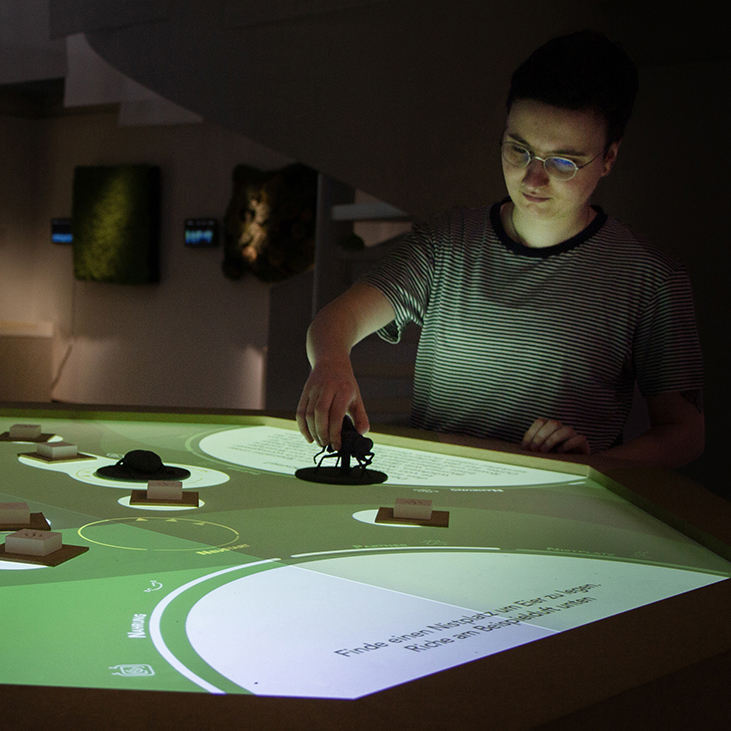
A scavenger hunt through the beautiful rieter park that invites the participants to explore the museum
Our strategy builds on the potential of the local families who regularly visit the restful Rieterpark, surrounding the museum to become long-term visitors. Despite the fact that the museum is a prominent part of the park our research showed that the majority of park visitors aren’t aware of the museum and it’s versatile offers. Our proposal aims to change that and enables the park visitors to explore the museum in a playful adventure.
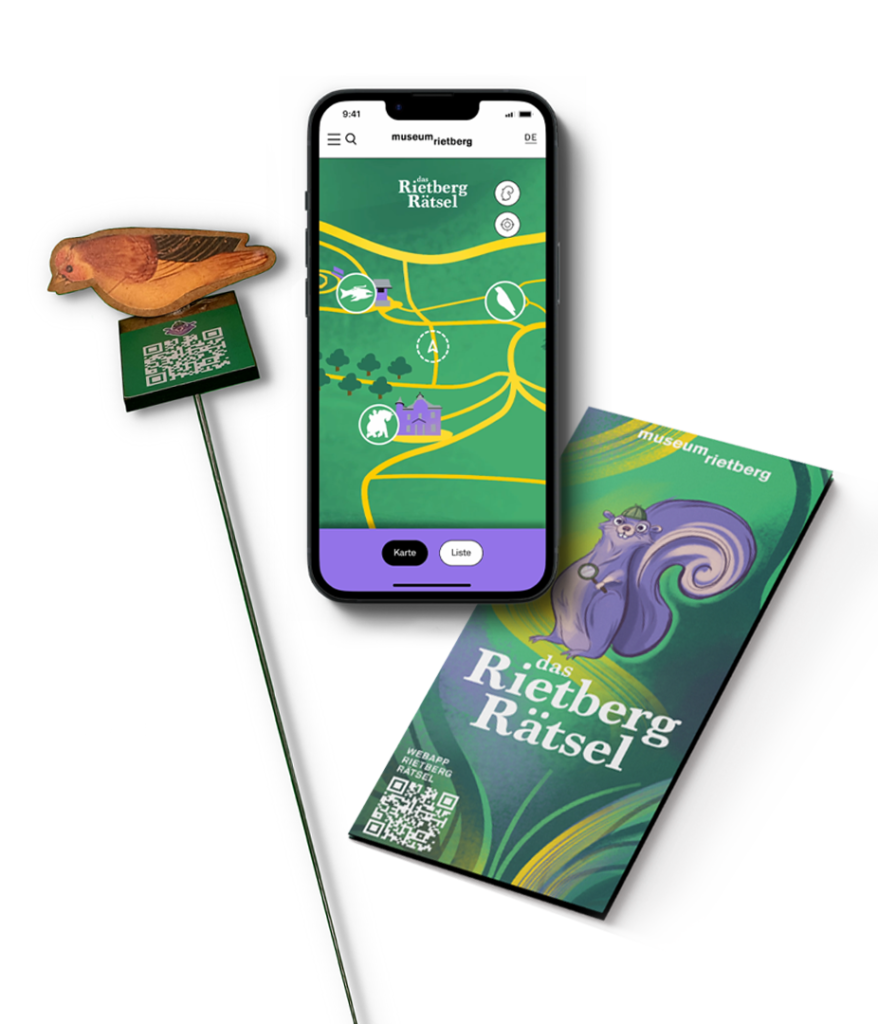
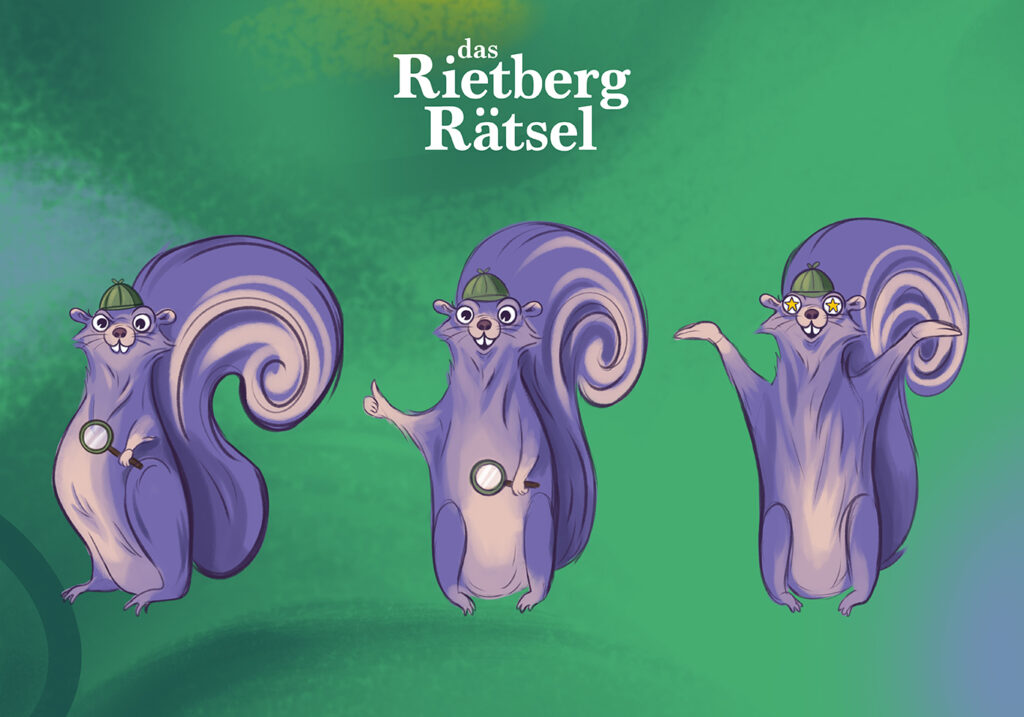
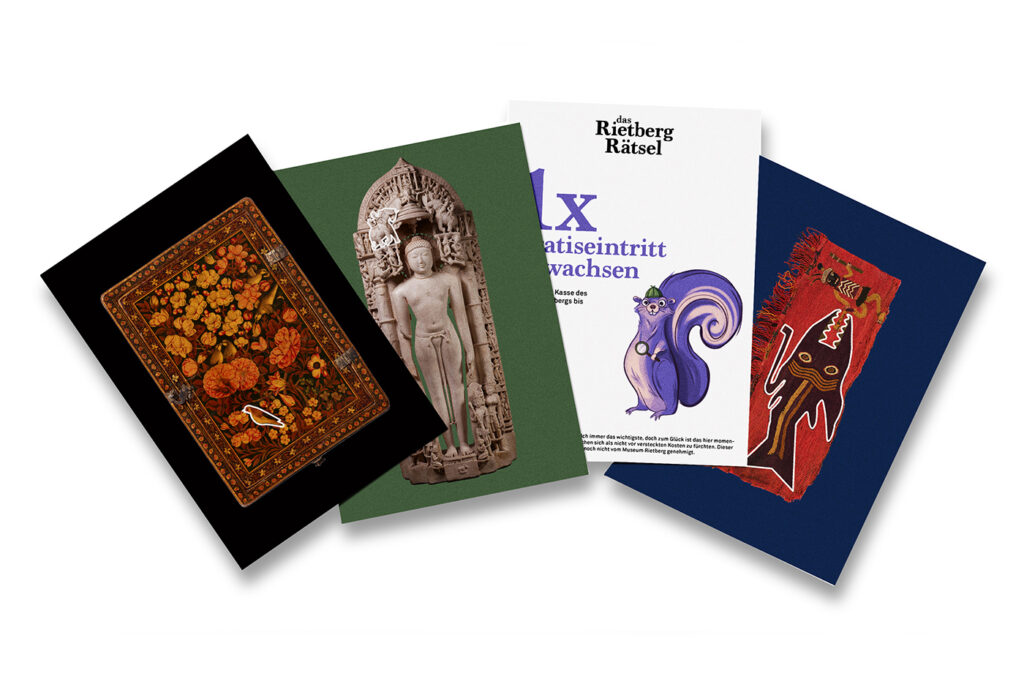
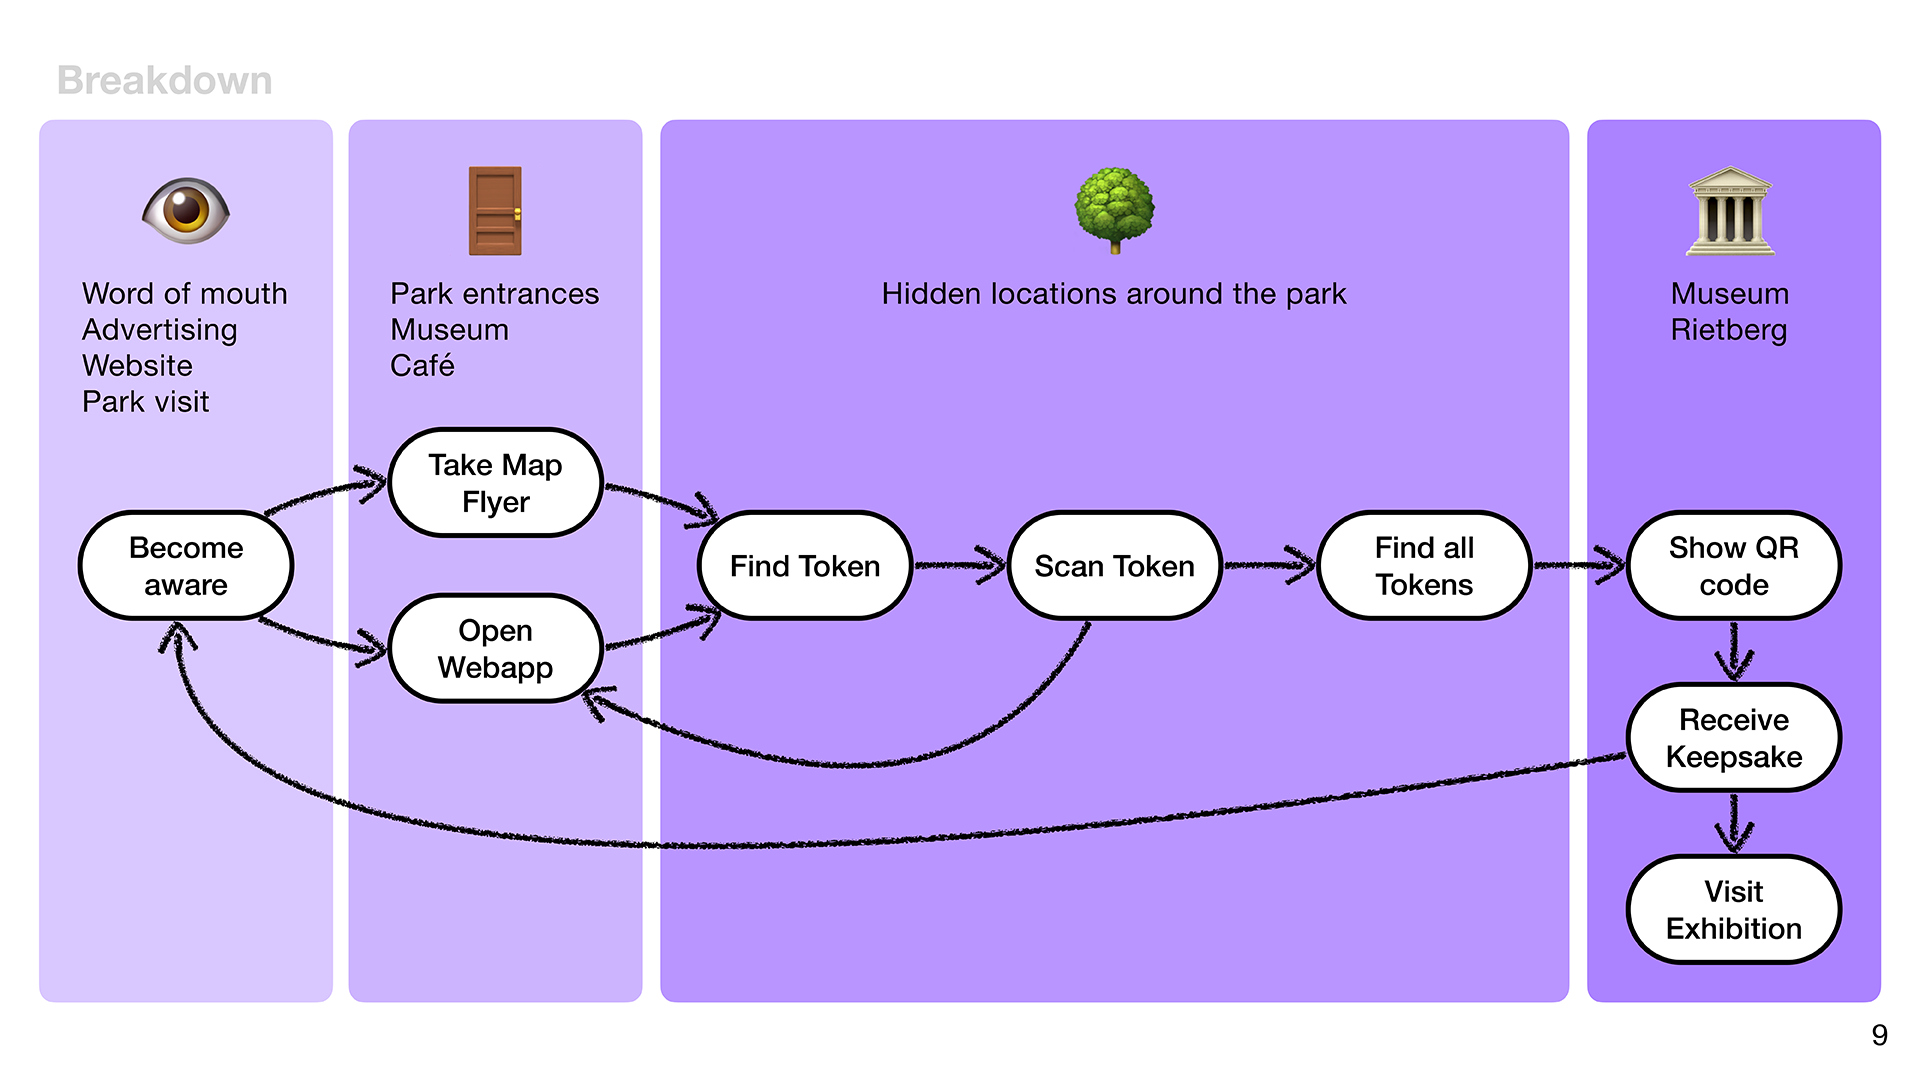
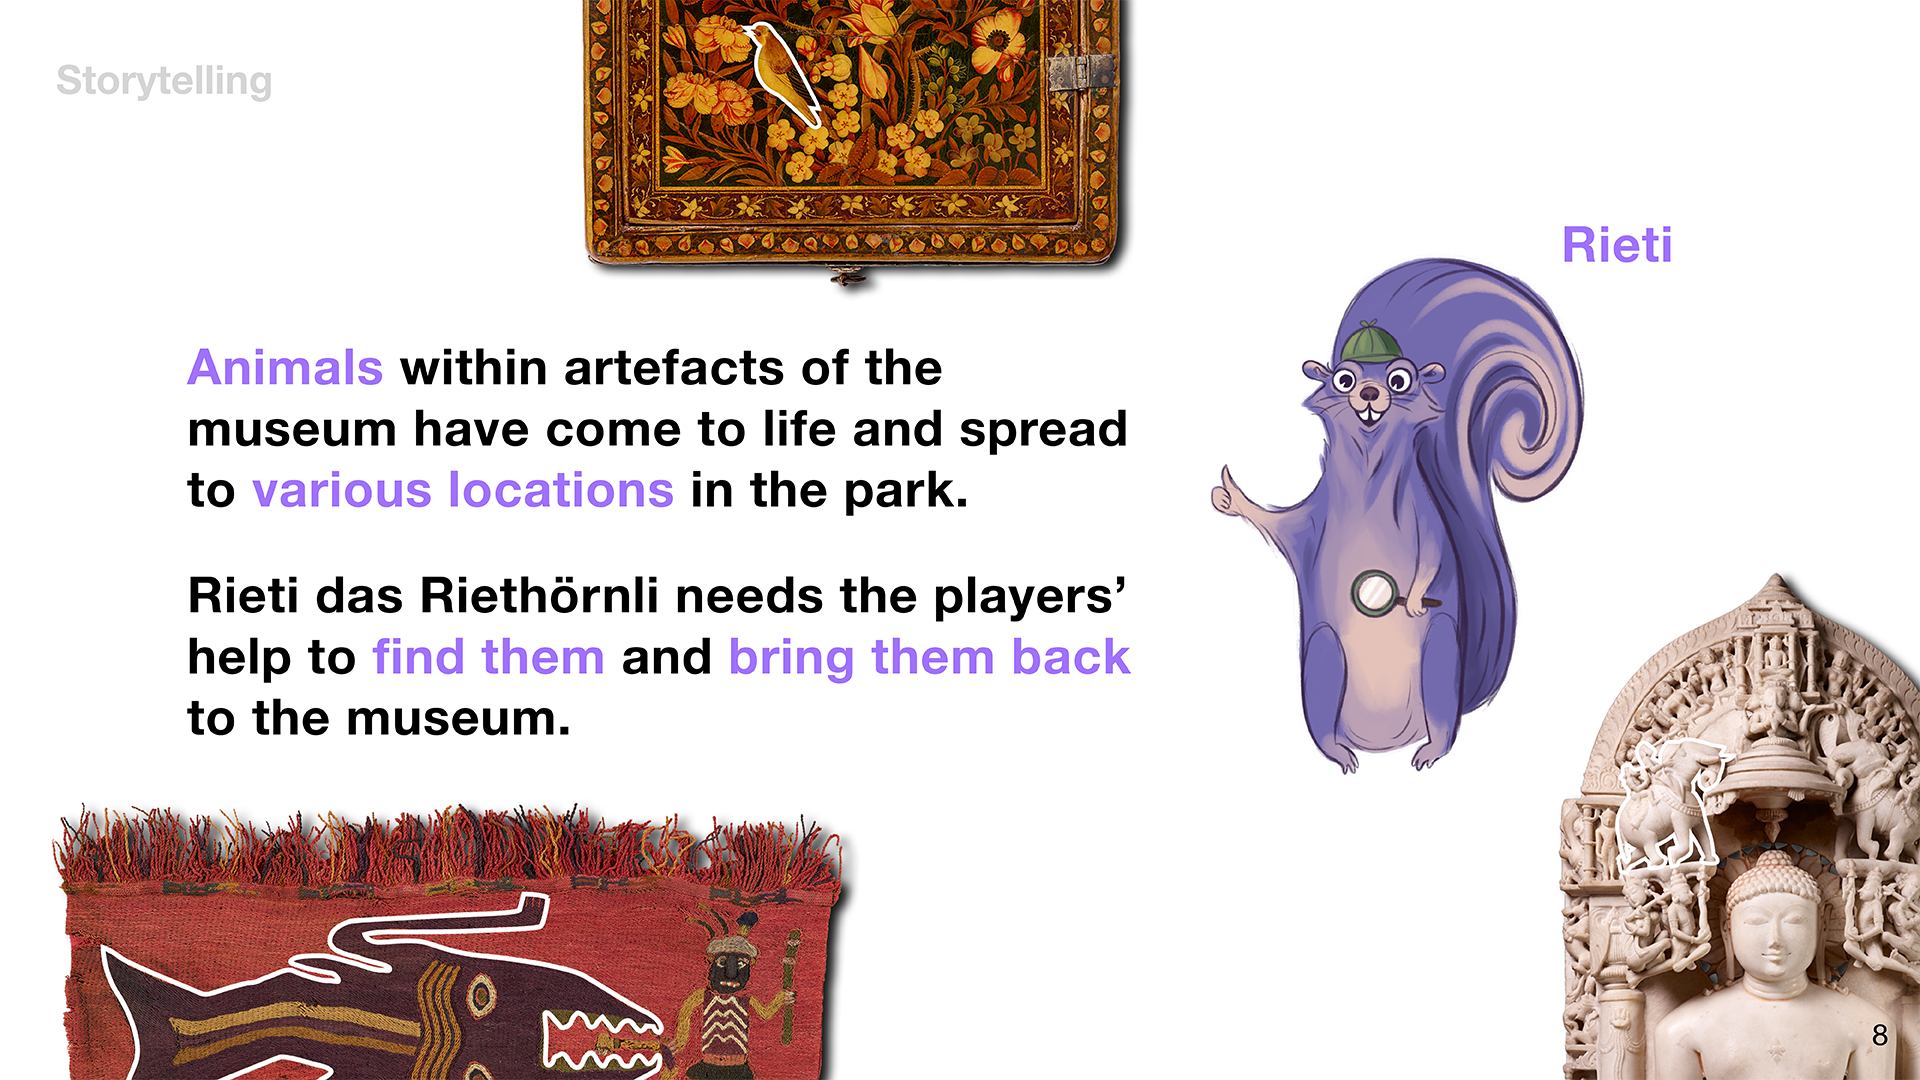
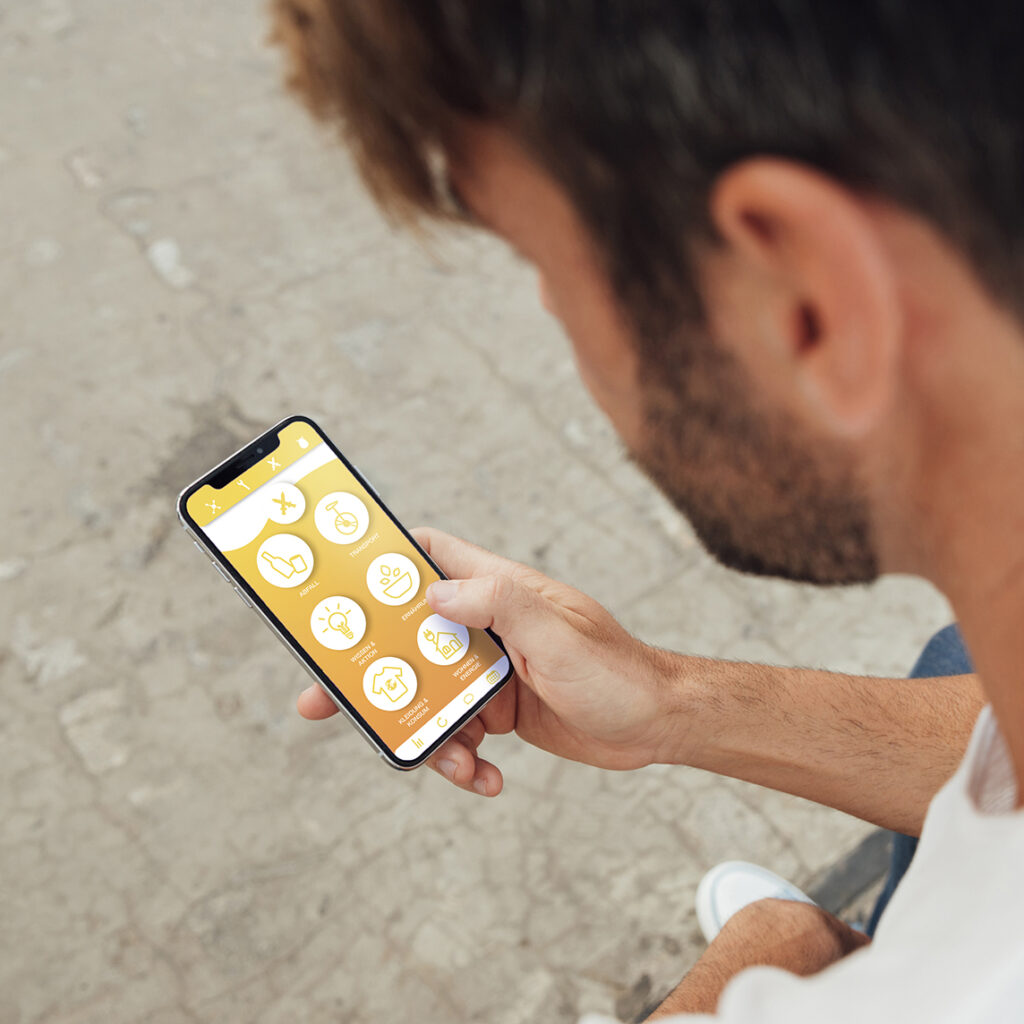
Das Rietbergrätselis a gamified experience that is part of a wider service concept for Museum Rietberg, the museum for non European art in Zurich. The goal of the experience is to draw the attention and interest of Rieterpark visitors to the versatile services and contents of the museum and attract new visitors. Particularly it aims to increase the museums second largest visitor demographic, families. In das Rietbergrätsel park visitors are encouraged to go on an adventure and search for hidden treasures in the park. The printed map and the web app guide them through the experience and gradually introduce them to the museums rich services and artifacts.
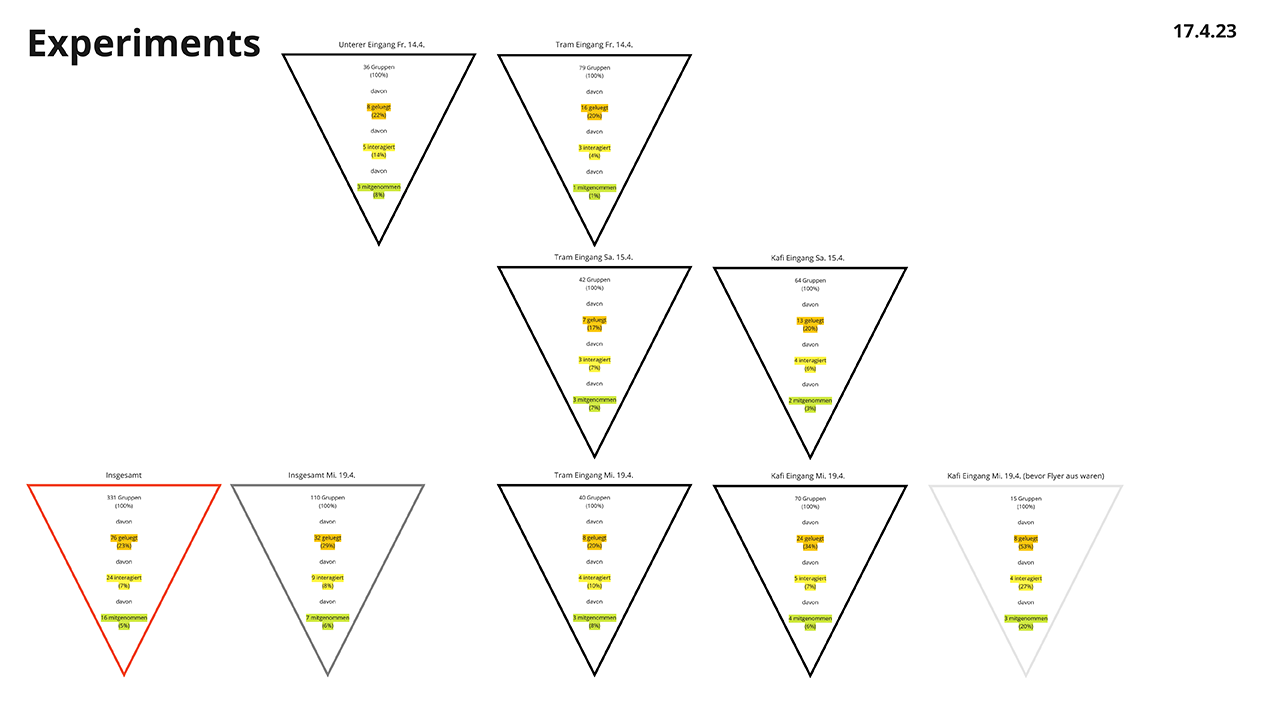
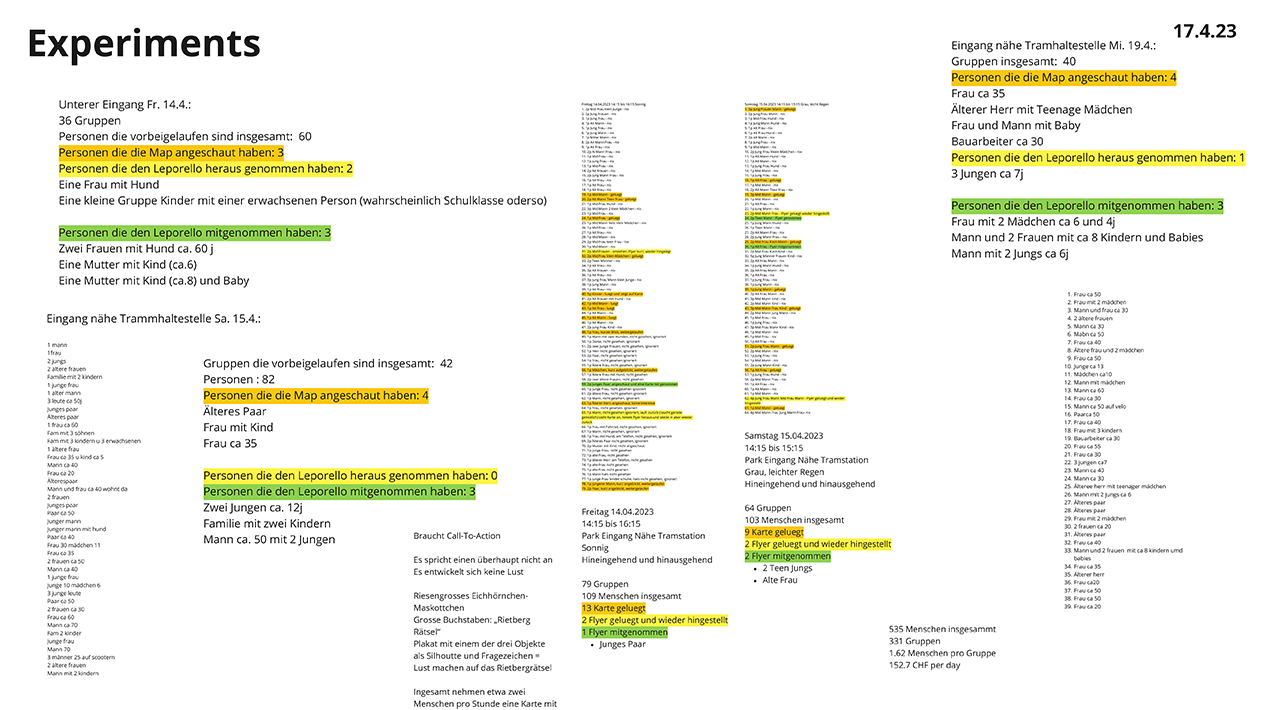
User Testing and Observation
Results
331 Groups
(1-5 People per Group)
Awareness
76 Groups (23%)
Interest
24 Groups (7%)
Action
16 Groups (5%)
Process
Methods
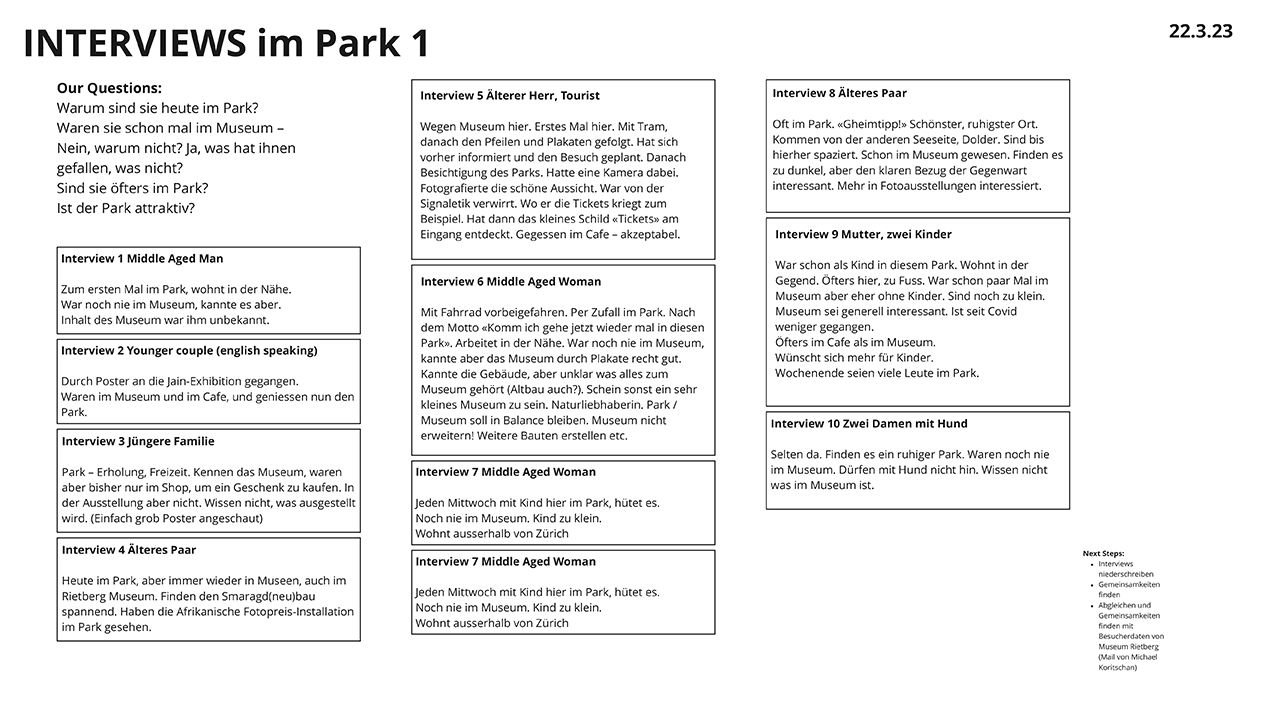
Interviews
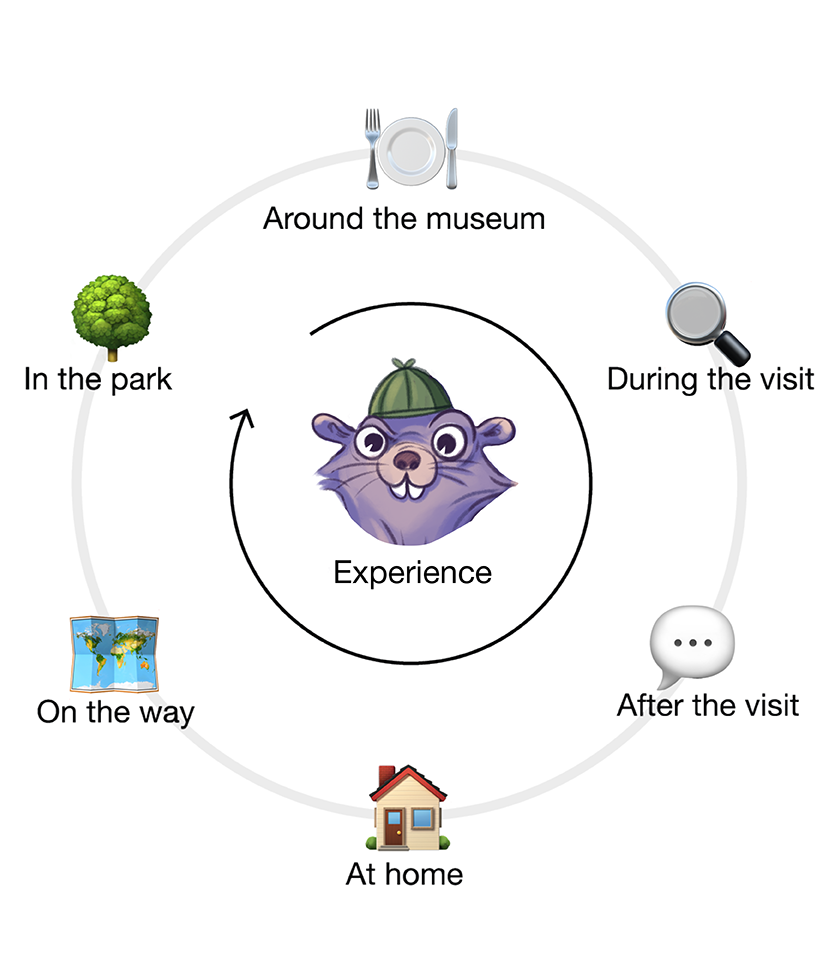
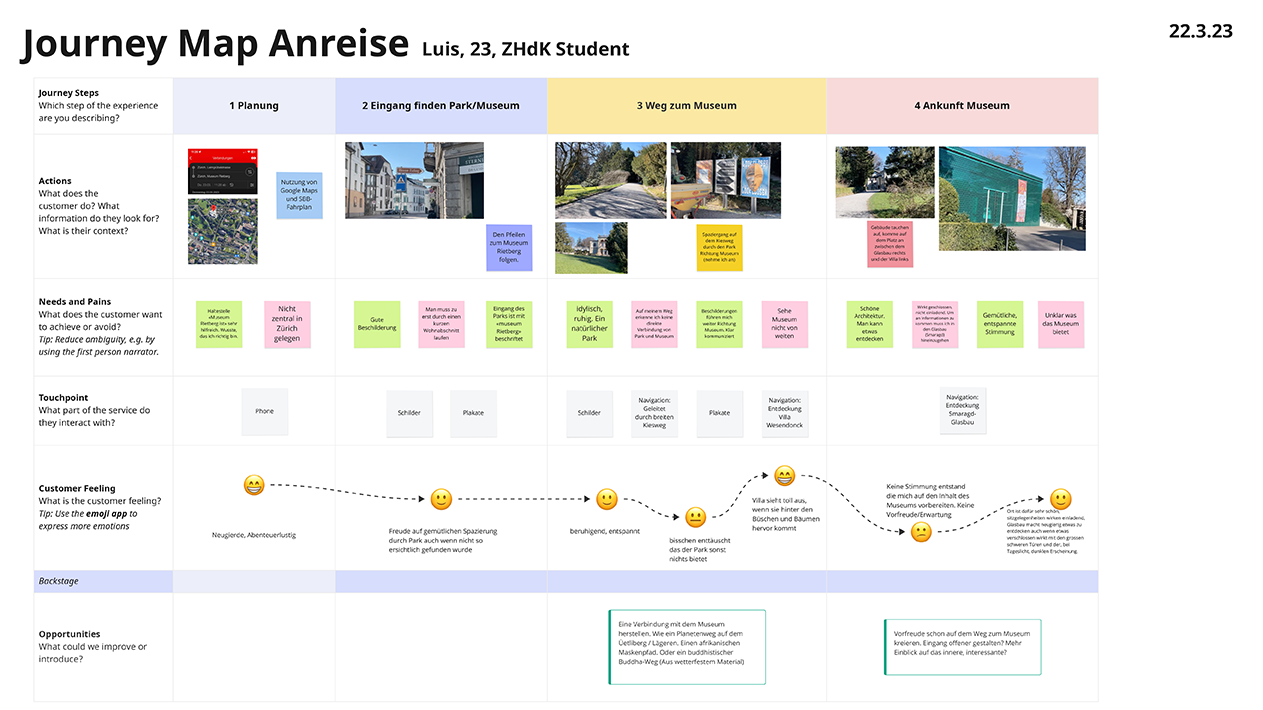
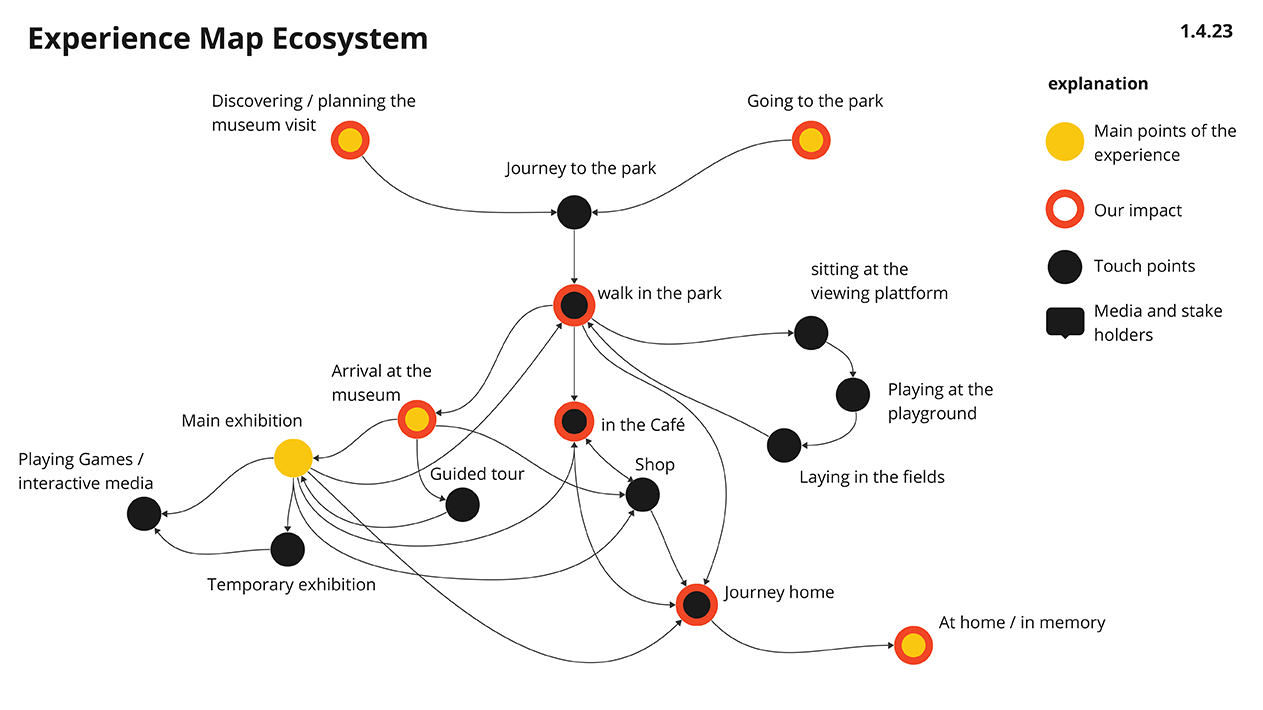
Journey Map
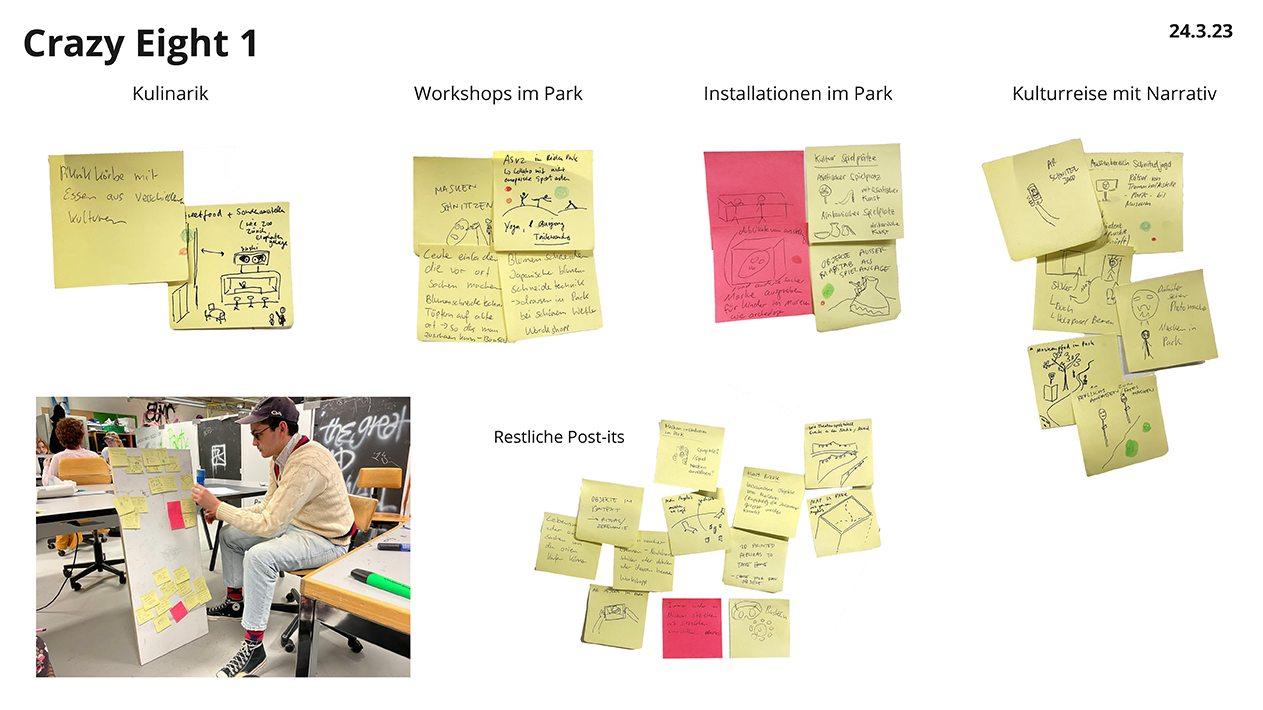
Crazy 8
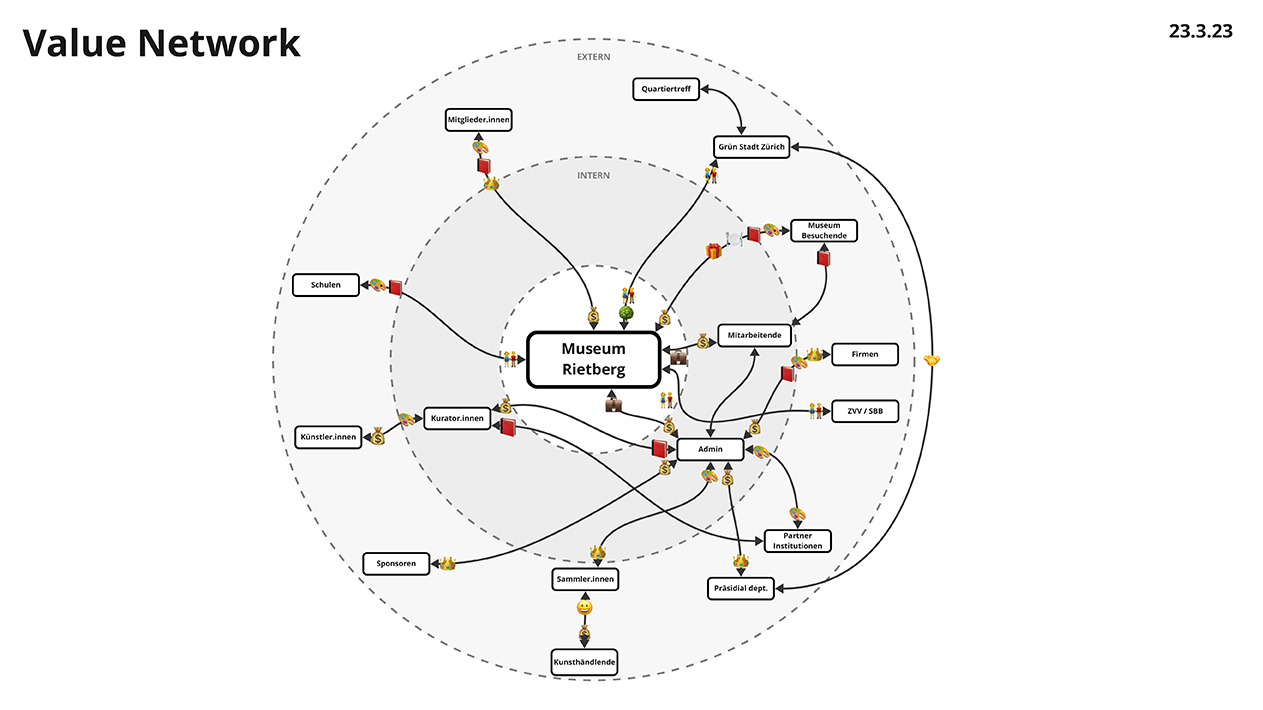
Stakeholder Map
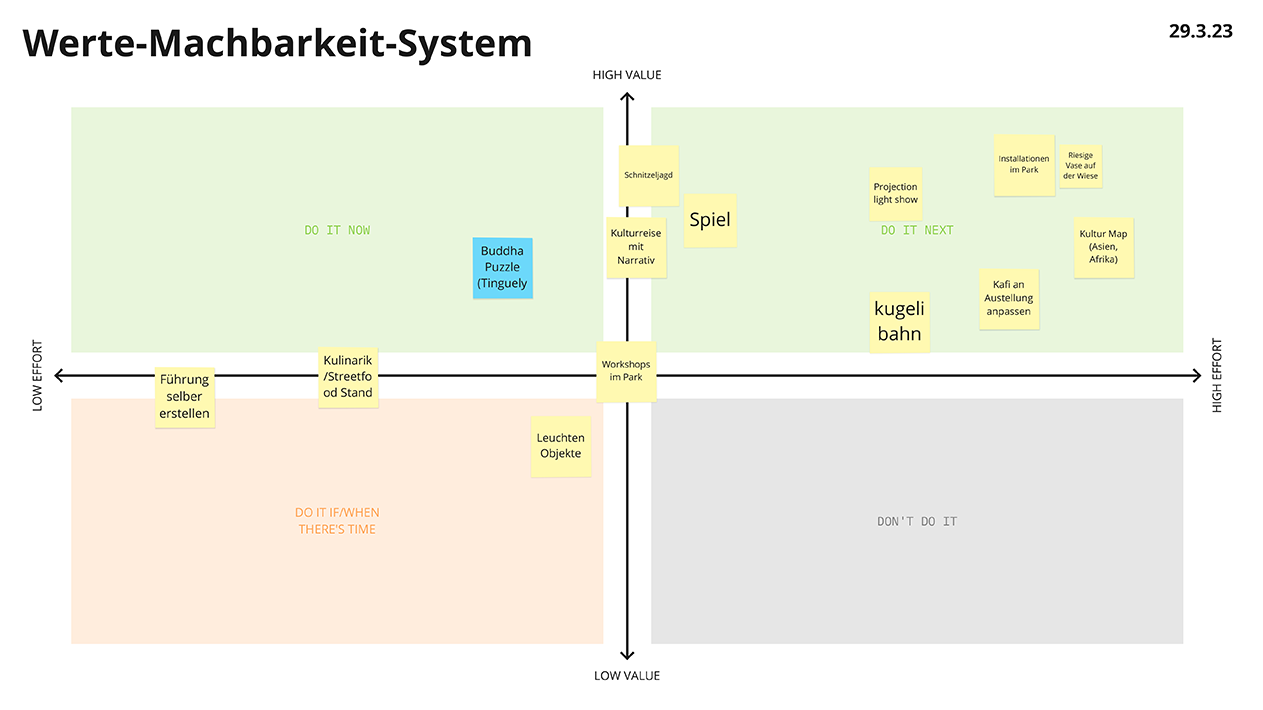
Impact/ Effort Matrix
Wireframes
Tools
Figma
Miro
Sticky Notes
Field and Desk
Research
The Project starts with asking the right questions, analyzing the situation and identifying the influences on the problem.
Interviews
Clustering
Journey Map
User Needs Analysis
Iteration
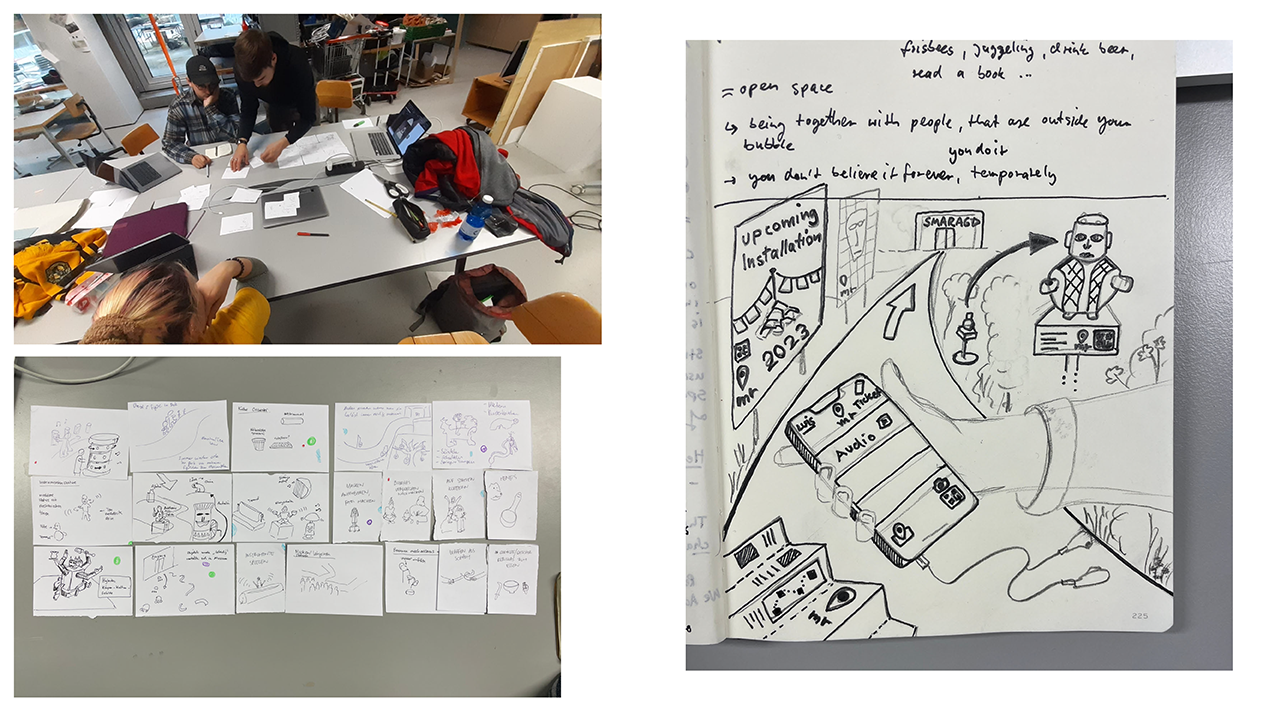
Ideation
Once we established a comprehensive overview of the situation, we are able to determine the potential of different parts of the system and brainstorm some first ideas for solutions.
Crazy 8
Clustering
Stakeholder Map
Impact/Effort Matrix
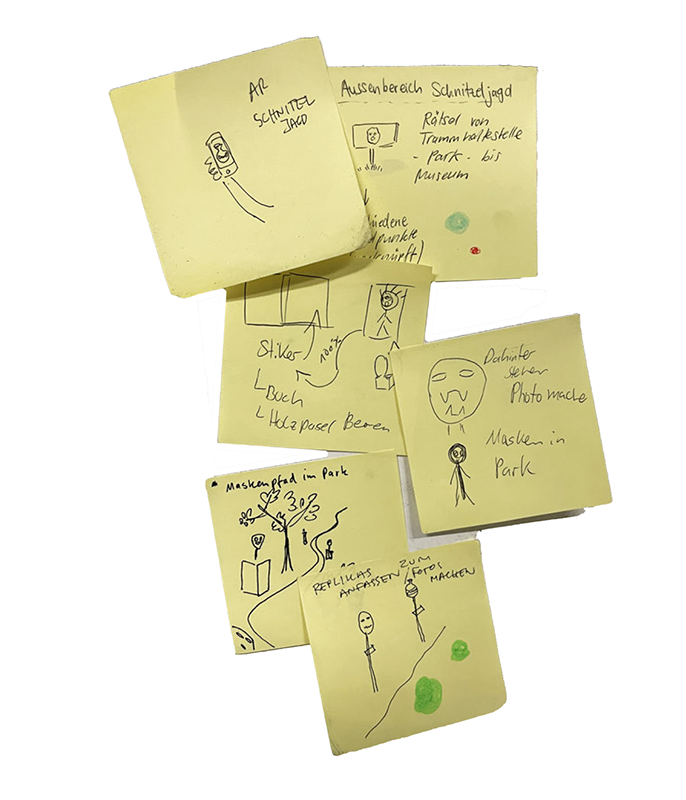
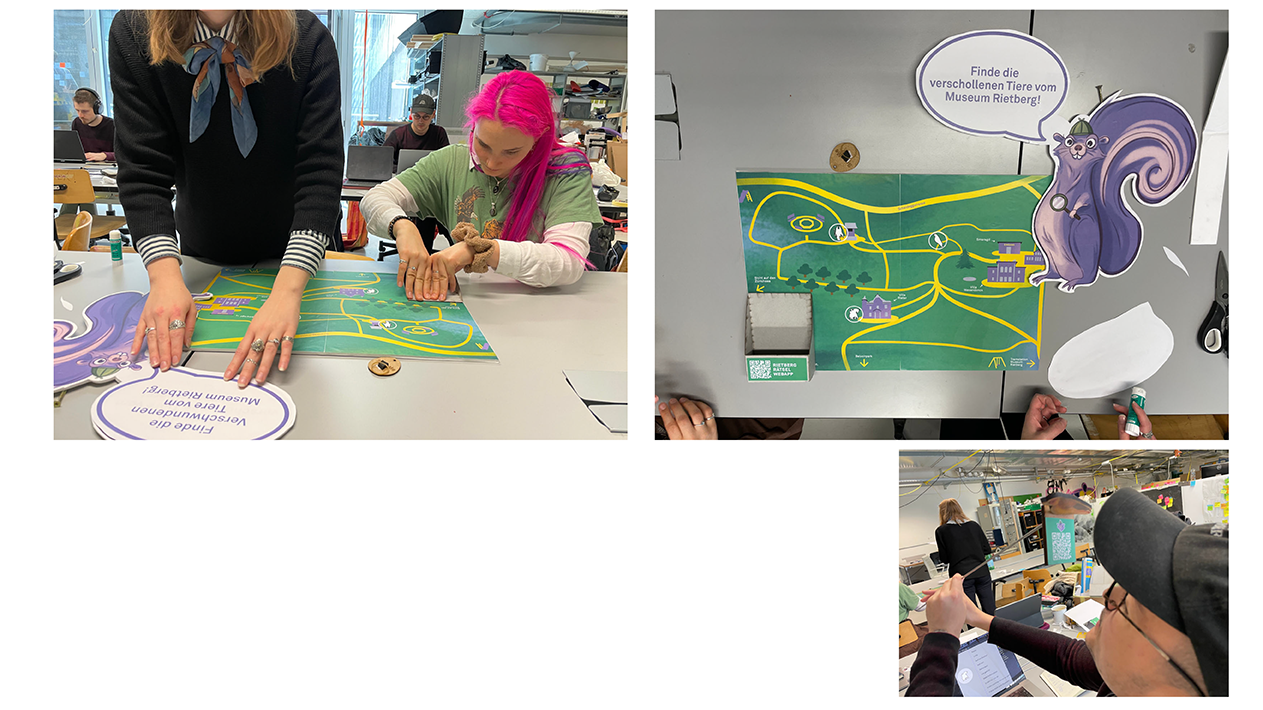
Experimentation
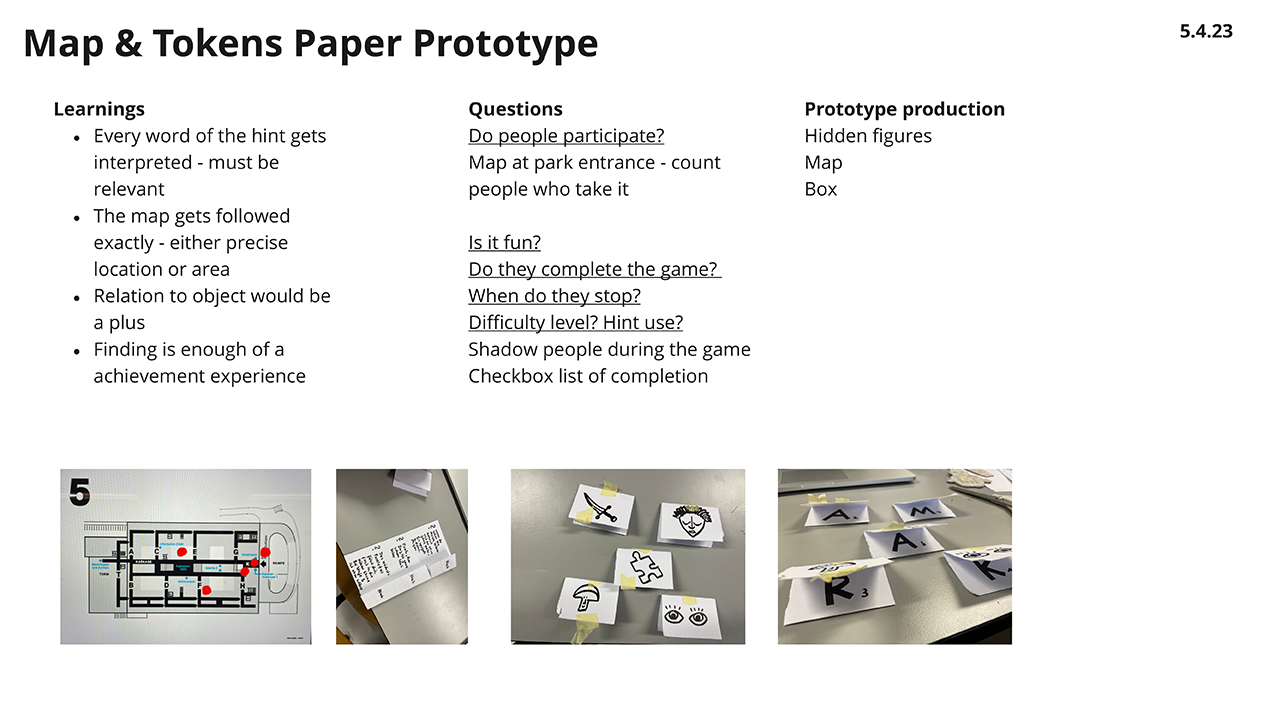
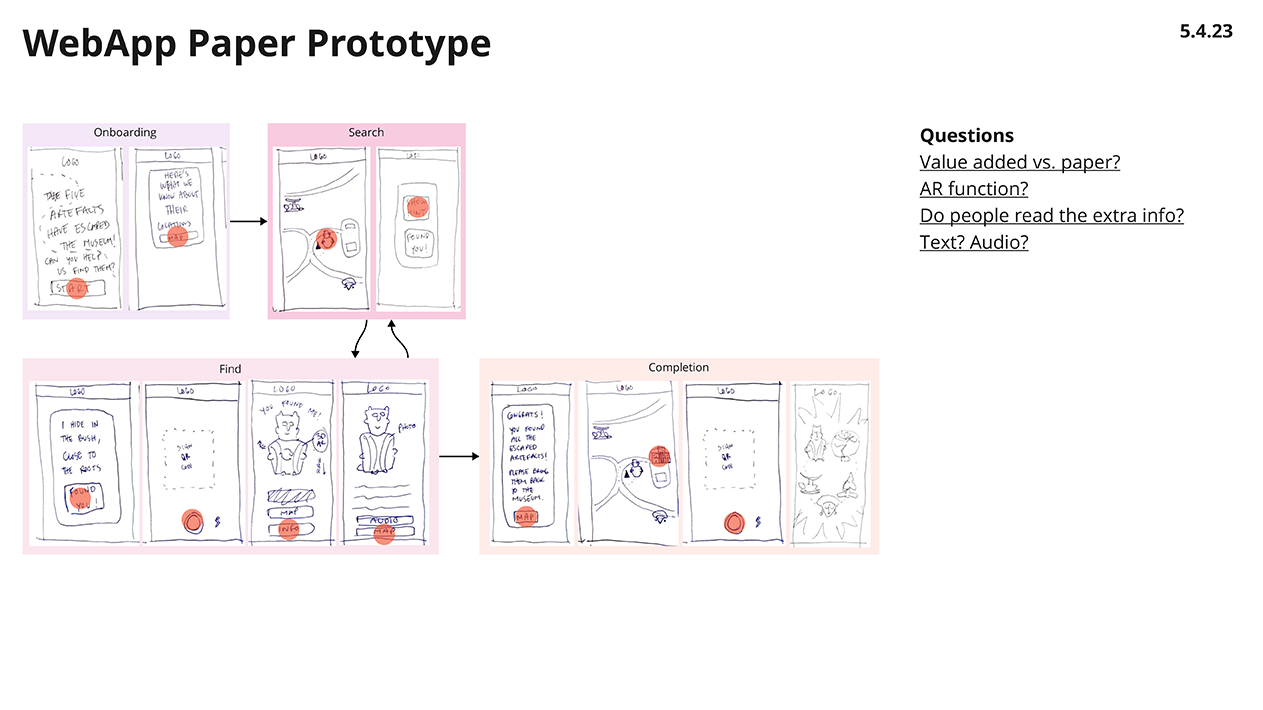
Prototyping
To explore and test our ideas efficiently we quickly assemble a few lofi prototypes and take action.
Sketching
Wireframes
Paper Prototypes
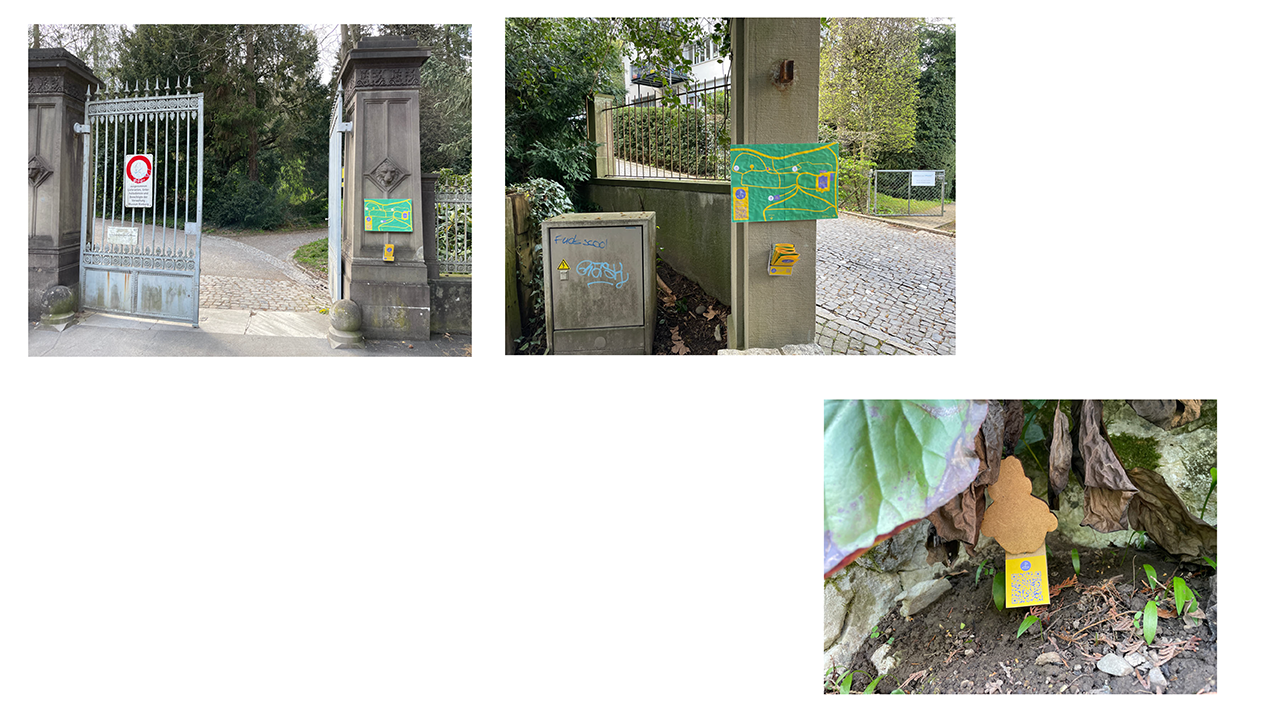
Crafting
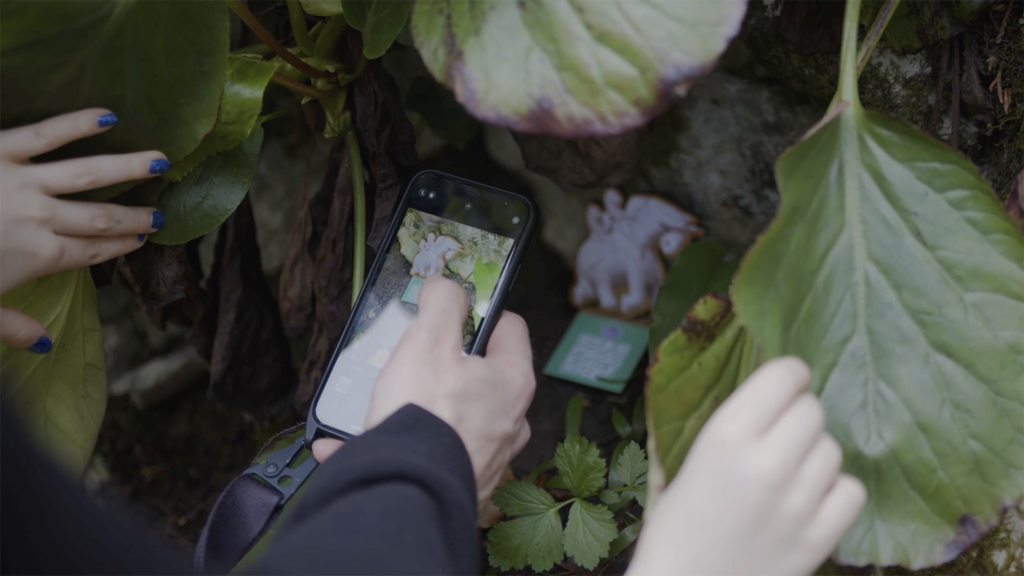
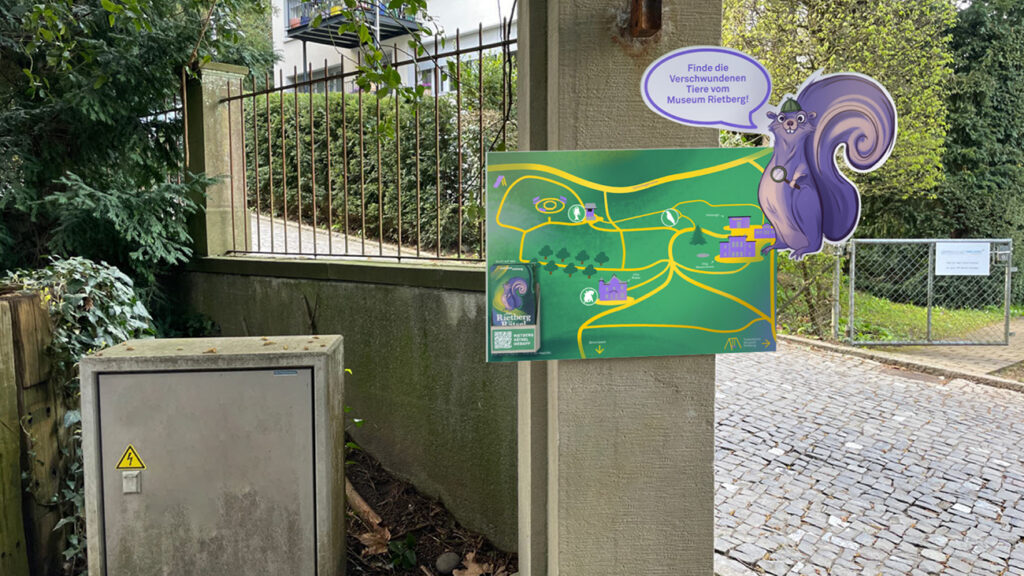
Testing
Evaluation
As the idea crystallizes we move to a more refined prototype that we test on site. This method allows us to collect data and gain invaluable insights that inform our next steps. The concept is enabled to reach it’s full potential
Observation
Data Collection
User Story
User Tests
Implementation
Deliver
An intense production phase follows. We get to work implementing our findings into the design and refine the user experience in greater detail. We flesh out the communication of the concept, our process and our findings.